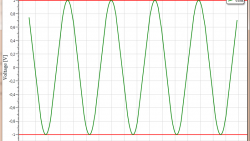
When logging datas from sensors it’s important to visualize them with a powerful real-time chart. In automation especially it’s common to analyze processes with the help of charts to predict and regulate the process. One of the most powerful charts (and for many the best) is Dynamic Data Display, an ...
Read More » Mesta Automation A blog about WPF, C# and PLC software development
